Request for Proposal ListingsData-Driven Decision-Support Dashboards - Student Consulting Project (Spring 2027)
Data-Driven Decision-Support Dashboards - Student Consulting Project (Spring 2027)
Interested in this engagement?

University of Miami
Data-Driven Decision-Support Dashboards - Student Consulting Project (Spring 2027)
03/15/2027 to 04/27/2027
Admin @ MiamiCollaboration Overview
About Students
About Program Goals
- Translate business questions into measurable KPIs.
- Clean, organize, and analyze relevant financial or operational data.
- Build interactive dashboards in Excel, Power BI, or Tableau.
- Conduct trend, scenario, and performance analysis.
- Translate findings into clear management recommendations.
- Present a working dashboard and recommendations to partner leadership.
About the Collaboration Format
Benefits for Industry Partners
- Interactive decision-support dashboard
- KPI scorecards and executive reporting
- Trend and performance analysis
- Scenario, budgeting, forecasting, or cash-flow models where relevant
- Data-backed recommendations
- Final executive presentation and live dashboard demonstration
- Early access to Miami Business School talent
Program Details
Students Include: Bachelor Degree
Students Enrolled: Students Enrolled
Program Duration: 6 weeks
Program Launch Date: 03/15/27
Program End Date: 04/27/27
Student Commitment: 4-7 Hours hrs/week
Course Format: Data Driven Decision Support Dashboards, Multiple Projects Multiple Teams
Modality: Fully Remote
# of Projects: 5
View All Program DetailsProject Requirements
| Industry Partner Requirements | |
|---|---|
| Project Topics | Budgeting, Forecasting, and Cost Optimization Data Management Operations Reporting, Financial Planning & Analysis Research, Analysis, Evaluation Strategic Planning |
| Location Preferences |
Located Anywhere |
| Compensation |
|
| Sponsorship |
Sponsorship Requested (Optional):Pre-Revenue Startup an exact contribution amount of $500.0 Growth Startup an exact contribution amount of $500.0 Small to Medium Business an exact contribution amount of $500.0 Large Enterprise an exact contribution amount of $500.0 Government Organization an exact contribution amount of $500.0 Non-Profit an exact contribution amount of $500.0 |
| Other Requirements | Ideal partners should:
Sensitive data can be scoped, anonymized, or limited as appropriate before the project begins.
|
| Project Management Time Commitment | 1 Hour per week |
| Interested Industries | Consulting & Professional Services Consumer Products & Services Finance & Investment Food & Beverage Health Care & Life Sciences Manufacturing & Industrial Retail & E-Commerce Software, AI & Data Sports & Entertainment Transportation & Logistics Travel & Tourism |
Skills & Expertise
Business Analytics Business Intelligence Cash Flow Analysis Dashboard Design Data Analysis Data Cleaning Data Modeling Data Visualization Excel Executive Presentations Executive Reporting Financial Modeling Forecasting KPI Development Operational Analytics Performance Measurement Power BI Scenario Analysis Tableau Trend Analysis| Key Program Dates | Due Date |
|---|---|
|
Request for Proposal published
Collaboration request published. Industry Partners may express interest in participating.
|
Oct 09 2026, 05:33 AM UTC |
|
Interview
Educators will begin interviewing interested Industry Partners to discuss project ideas.
|
Oct 24 2026, 05:33 AM UTC |
|
Proposal Application Deadline
Final date for Industry Partners to express interest in participating.
|
Jan 26 2027, 05:33 AM UTC |
|
Finalize Project Charter
Educators and Industry Partners finalize project charters, legal documents, and background materials.
|
Feb 11 2027, 05:33 AM UTC |
|
Official Program Launch
We’ll find a time on this day for you to meet with the students to kick off your project.
|
Mar 15 2027 |
|
Official Program End
We’ll find a time on this day for you to meet with the students to wrap up your project.
|
Apr 27 2027 |
* We’ve got some inspirational project ideas below! These are related project topics that you can mix and match the components for the best cross-functional project experience possible.
Budgeting, Forecasting, and Cost Optimization
Data Management
Operations
Reporting, Financial Planning & Analysis
Research, Analysis, Evaluation
Strategic Planning
| Program Overview | ||
|---|---|---|
| Program Title | Data-Driven Decision-Support Dashboards - Student Consulting Project (Spring 2027) | |
| Organization | University of Miami | |
| # of Students Enrolled |
0
|
|
| # of Projects Running |
0 Project/s Added (of 5 Projects Expected)
|
|
|
Program Timeline Project Duration |
Start Date: 03/15/27 End Date: 04/27/27 1 month |
|
| Collaboration Overview | ||
|---|---|---|
| About Students |
Undergraduate Miami Business School students work in small teams with faculty oversight and student coaches. Students apply business analytics, financial modeling, data visualization, KPI development, and executive communication to a live organizational challenge.
Student Level: Bachelor Degree Student Time Commitment: Full Time Team Structure: 3 - 6 |
|
| Program Goals | Students will:
|
|
| Format Structure |
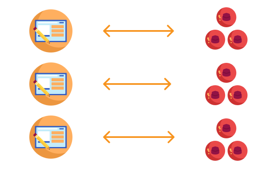
Multiple Projects Multiple Teams |
|
| Format Title | Data Driven Decision Support Dashboards | |
| Format Description | Partner with undergraduate Miami Business School students to turn financial and operational data into practical decision-support tools. Student teams use Excel, Power BI, and Tableau to identify meaningful KPIs, analyze trends, model scenarios, and build interactive dashboards that help managers make faster, better-informed decisions. Typical projects address sales, operations, inventory, budgeting, forecasting, cash flow, resource allocation, or performance monitoring. A prior Miami Digital-First project used Australian Open 2026 event data from BigQuery to build Tableau dashboards and KPI scorecards that became a reusable reporting template for future event clients.
|
|
| Benefits For Industry Partners | Partners receive:
Miami’s project archive includes a completed Australian Open 2026 analytics engagement where students transformed multiple event-data feeds into an executive Tableau suite.
|
|
| Project Modality | Fully Remote | |
| Industry Partner Requirements to Participate | ||
|---|---|---|
| Project Topics | Budgeting, Forecasting, and Cost Optimization Data Management Operations Reporting, Financial Planning & Analysis Research, Analysis, Evaluation Strategic Planning | |
| Target Industries | Consulting & Professional Services Consumer Products & Services Finance & Investment Food & Beverage Health Care & Life Sciences Manufacturing & Industrial Retail & E-Commerce Software, AI & Data Sports & Entertainment Transportation & Logistics Travel & Tourism | |
| Skills & Expertise | Business Analytics Business Intelligence Cash Flow Analysis Dashboard Design Data Analysis Data Cleaning Data Modeling Data Visualization Excel Executive Presentations Executive Reporting Financial Modeling Forecasting KPI Development Operational Analytics Performance Measurement Power BI Scenario Analysis Tableau Trend Analysis | |
| Location Information & Preferences |
Located Anywhere Priority will be given to organizations with a meaningful business question, usable data, strong mentorship, and potential career opportunities for exceptional student contributors.
|
|
| Sponsorship |
Sponsorship Requested (Optional):Pre-Revenue Startup an exact contribution amount of $500.0 Growth Startup an exact contribution amount of $500.0 Small to Medium Business an exact contribution amount of $500.0 Large Enterprise an exact contribution amount of $500.0 Government Organization an exact contribution amount of $500.0 Non-Profit an exact contribution amount of $500.0 |
|
| Compensation |
No Compensation Required |
|
| Other Requirements | Ideal partners should:
Sensitive data can be scoped, anonymized, or limited as appropriate before the project begins.
|
|
| Expected Time Commitment For Project Managers | 1 Hour per week | |
| Key Program Dates | Due Date |
|---|---|
|
Request for Proposal published
Collaboration request published. Industry Partners may express interest in participating.
|
Oct 09 2026, 05:33 AM UTC |
|
Interview
Educators will begin interviewing interested Industry Partners to discuss project ideas.
|
Oct 24 2026, 05:33 AM UTC |
|
Proposal Application Deadline
Final date for Industry Partners to express interest in participating.
|
Jan 26 2027, 05:33 AM UTC |
|
Finalize Project Charter
Educators and Industry Partners finalize project charters, legal documents, and background materials.
|
Feb 11 2027, 05:33 AM UTC |
|
Official Program Launch
We’ll find a time on this day for you to meet with the students to kick off your project.
|
Mar 15 2027 |
|
Official Program End
We’ll find a time on this day for you to meet with the students to wrap up your project.
|
Apr 27 2027 |

Admin @ Miami
View Profile
Liam Anderson
View Profile
Alexander Korogodsky
View ProfileResources
| Links & Documents |
|---|
| Miami Digital-First Lab |
| BI & Dashboards Capability |
| Australian Open 2026 BI Project |
Projects
| Project | Organization | Topics |
|---|